
Last updated:
The diesel vs natural gas generator decision starts with operating duty, fuel security and the load the system must serve. Compare complete systems using local costs and data for each model. Annual running hours alone can’t select the winner.
A cheaper fuel is little help if the proposed package cannot start the required loads or receive fuel during the event it must cover. Yet a higher purchase price need not mean a higher lifetime cost. Link those checks to a cost model that someone else can check.
This guide compares industrial diesel with pipeline-natural-gas generation. You will learn what to ask suppliers and how to calculate payback. You will also see which inputs can reverse the result. Gasoline, LPG and delivered natural gas need their own supply plans.
Key takeaways
- Define duty and load response before comparing fuel prices.
- Compare the same installed scope, net output and ownership period.
- Calculate running costs from local tariffs and load-specific fuel curves.
- Treat payback hours as cumulative runtime, then convert them to years.
- Verify fuel supply, permits and performance for the exact proposed package.
Start with duty, fuel access and site constraints
Separate operating duty from installation type
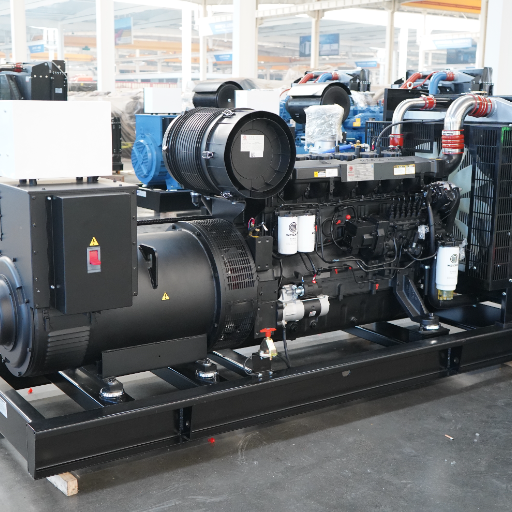
What must the generator do: cover an outage, supply off-grid power, or support planned demand management? Write down that role before asking for prices. Then state the load pattern, running hours and site conditions.
How long can the loads remain without power? Annual hours alone don’t replace the maker’s declared duty rating.
Our prime and standby rating guide explains the rating question. A stationary generator means a fixed set. Standby describes its role. The stationary versus standby comparison helps separate those labels when reviewing offers.
Illustrative scenario: A facility needs power only when the grid fails. Another needs power each day while waiting for the grid. Their peak loads may match, but their duty, fuel contracts and service plans can differ. Both need to check the proposed sets.
A rule based on annual hours can’t do that work.
Before asking for an offer, use the rating guide to state your duty and load profile. Give each bidder the same brief. That makes gaps between offers easier to see.
Create a site-constraints decision matrix
Check that each option can work before you compare savings. If a set can’t meet a condition, address the design. Don’t hide the problem in an average score.
| Site question | Evidence to obtain | Selection consequence |
|---|---|---|
| Can diesel be stored and replenished? | Usable volume, delivery access and fuel-system design | Defines the basis for stored-fuel autonomy |
| Can gas supply the proposed load? | Pressure, flow, quality and contract conditions | Establishes whether pipeline operation is feasible |
| Can the package restore the required loads? | Start sequence and model-specific load-step data | Screens performance before cost comparison |
| Is the operating role permitted? | Local operating and site approval requirements | Determines which hours can enter the cost model |
| What site conditions apply? | Temperature, altitude and installation limits | Establishes the net output to compare |
List open questions and who must answer them. Match the set’s gas-flow needs with the utility’s pressure data at the same conditions. Two broad assurances don’t prove that the supply will work.
Why on-site prime power is in the 2026 discussion
The IEA’s Powering Artificial Intelligence report, published October 14, 2026, discusses grid access and on-site power in data-centre planning. Keep primary supply and emergency backup distinct when reviewing such projects.
In a June 16, 2026 announcement, Cummins described natural gas sets for Circe Energy’s behind-the-meter primary-power development in West Texas. Deliveries were scheduled for 2026 to 2030.
This is a supply plan. It doesn’t prove that the site is running or has achieved savings, and it makes no claim about Huali. The plan doesn’t tell another site which fuel to choose.
Compare installed scope and lifetime running costs
Compare equal installed scope
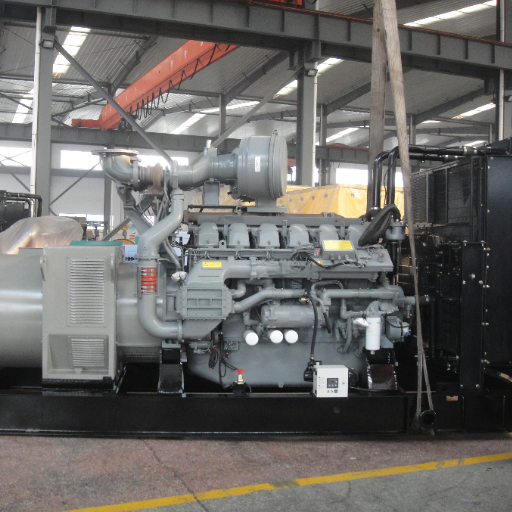
The set price is only one line in the cost model. Compare the same duty, usable output, voltage and frequency. State the site conditions and the tests each set must pass. Ask each bidder to mark what its price includes and excludes on one scope sheet.
Generac’s total-cost-of-ownership paper separates capital, fuel, maintenance and other ownership costs. Its old prices aren’t current quotes. Use the cost headings, then add your own figures and source documents.
For diesel, price the tank, transfer pumps, pipes and delivery access. Include spill containment where required. A generator day tank may be part of the design.
Don’t treat the tank’s full stated volume as usable fuel or promised runtime. Check the full fuel system.
For gas, price any new supply line, meter, regulator, shut-off equipment and gas train the design needs. Agree the scope and timing with the utility.
Can the building’s gas service feed the set at full required flow? Check it; don’t assume it can. New gas sites also differ in the work they need.
Both offers should cover site work, protection, transfer gear, cooling air, exhaust, controls and commissioning. The stationary generator cost guide can help organize questions, but use project quotes for the figures. List work done by others. It still belongs in the total cost.
Use delivered fuel costs and load-specific consumption
Work out fuel costs at the loads you expect. Ask for each model’s fuel-use curve, units and test conditions. Don’t apply a full-load figure to every lower load.
| Cost input | Unit or boundary | Document and owner |
|---|---|---|
| Diesel consumption | Litres per running hour at each load | Model fuel curve; equipment supplier |
| Delivered diesel price | Currency per litre, on a defined tax basis | Fuel quotation; purchaser |
| Gas consumption | Energy per hour, or volume with stated conditions | Model data; supplier |
| Gas tariff | Currency per energy or volume unit, plus fixed charges | Utility tariff and contract |
| Electrical output | Net kW available to the agreed loads | Package and installation data |
| Annual operation | Hours in each load band | Site load study and duty plan |
| Maintenance | Variable and fixed costs over the same period | Service plan and quotation |
Diesel fuel cost per hour equals litres per hour multiplied by delivered price per litre. Gas fuel cost per hour uses consumption and tariff in matching units. Divide either hourly fuel cost by net electrical kW to obtain fuel cost per electrical kWh at that operating point.
If gas is billed by volume, match the heating value and reference conditions. Check whether the data uses higher or lower heating value. Keep fixed charges apart from fuel-use charges. Use the same currency and tax basis for both fuels.
Use the fuel consumption calculator for an initial estimate, then replace it with selected-model data and local prices. The diesel fuel consumption guide provides background rather than a substitute for that fuel curve.
Make a load-band worksheet you can update
Do not blend every load into one guessed fuel cost. Use a row for each load band, then total the rows. Keep the hours for testing and planned use visible too. They must be allowed by the duty rating and site rules.
For each row, enter:
- Net output in kW and expected hours at that load.
- Diesel use per hour from the proposed model’s curve.
- Gas use per hour in units that match the tariff.
- Delivered price for each fuel on the same date and tax basis.
- Variable service cost, with its source and scope.
Multiply kW by hours to check the energy supplied in each row. Both options must serve the same load schedule.
Then multiply each fuel’s hourly cost by the row’s hours. Add the rows before applying annual fixed charges. Do not charge a full year’s standing fee in every row.
If no measured load profile exists, mark the schedule as assumed. Test a lower-use case as well as the planned case. Get better load data before treating the result as a buying forecast. Keep the worksheet simple enough for the site team to revise when the load changes.
Separate scheduled and calendar maintenance
Compare the service manuals and the scope of each service quote. Include parts, fluids, labour, checks and planned downtime. Price any overhaul or replacement due within your chosen period.
Check both hour-based and date-based limits. A set used for few hours still needs care.
Don’t assume either fuel always needs fewer oil changes or lasts longer. The generator lifespan guide is a separate planning resource; use the actual service plan for each model in the cost model. How will you supply power while a unit stops for work? Include that plan.
Calculate diesel vs natural gas generator payback correctly
Check the units before reading the result
Payback shows how long savings take to recover extra spending. First check which option costs more to install. Suppose gas costs more, but saves money on fuel each running hour:
Cumulative fuel-only payback hours = extra installed investment / fuel saving per running hour
Dollars divided by dollars per hour gives hours. The result is total running time built up over the years. It is not an annual-hours rule. Divide by annual runtime to find payback in years.
For a fuller model, use the same load bands for both options. In each band, multiply hours by the saving in cost per running hour. Add the savings across the year. Then include fixed costs and any proven net income difference for which the project is eligible.
Net annual saving = annual variable-cost savings + diesel fixed annual cost - gas fixed annual cost + eligible net revenue difference
Simple payback years = extra installed investment / net annual saving
Use the payback formula when net annual savings are positive. If savings are zero or less, they won’t repay the extra spending. If gas doesn’t cost more to install, compare cash flows directly. You don’t need to force a premium into the formula.
Work through a clearly hypothetical 1 MW example
Illustrative scenario: all inputs below are assumed to show the maths. They are not market prices, typical loads, quotes or customer results.
Assume gas costs an extra $160,000 to install. Assume a steady load of 700 kW from a 1,000 kW set. Use assumed fuel-only costs of $0.32/kWh for diesel and $0.12/kWh for gas.
The 1 MW generator planning guide covers the separate equipment-selection questions. This calculation does not establish that either proposed set can deliver the assumed output under your conditions.
| Input or calculation | Assumed value or arithmetic result |
|---|---|
| Generator rating used for the example | 1,000 kW |
| Constant assumed load | 70%, giving 700 kW |
| Extra installed gas investment | $160,000 |
| Fuel-only saving per electrical kWh | $0.32 – $0.12 = $0.20 |
| Fuel saving per running hour | 700 × $0.20 = $140/hour |
| Cumulative fuel-only payback | $160,000 / $140 = about 1,143 hours |
| At an assumed 300 hours/year | About 3.81 years |
| At an assumed 1,500 hours/year | About 0.76 years |
Both schedules give the same total payback hours. The extra cost and hourly saving haven’t changed. The time in years has changed. Neither 300 nor 1,500 annual hours is a rule for other projects.
The numerator is the extra installed investment, not the cheaper system’s purchase price or the total fuel bill. The denominator is the cost saving, not either system’s fuel cost alone. This example leaves out service-cost differences, fixed charges, finance, taxes, discounting and resale value.
For a chosen five-year recovery target, the fuel-only annual runtime is about 229 hours: $160,000 divided by five years and $140 per running hour. That result applies only to these inputs. Change the fuel spread, load or fixed costs and the answer changes.
Stress-test low hours, fuel spread and fixed costs
Test changes in costs and hours. At the same 700 kW, halve the assumed fuel spread from $0.20 to $0.10/kWh. The saving falls from $140 to $70 per hour.
Fuel-only payback doubles to about 2,286 total running hours. That still leaves out other costs.
Now keep the assumed $140 hourly saving and 300 annual hours. Add an assumed $20,000/year in extra gas fixed costs. Fuel savings are $42,000/year, but net savings fall to $22,000.
Simple payback becomes about 7.27 years. These charges are made up to explain the maths. They aren’t a tariff estimate.
Also test higher site-work costs, fewer allowed running hours and changed service costs. Don’t count demand-response income before checking the scheme’s rules and your right to take part. Get the payment basis in writing. Count each benefit once, whether as a cost saving or as income.
For a selected recovery period, positive hourly variable-cost savings and constant operating conditions:
Required annual hours = (extra investment / target years + extra gas fixed annual cost - eligible annual net revenue advantage) / hourly variable-cost saving
If the result is negative or the load varies, inspect the inputs and cash flows. Don’t present a negative answer as required runtime.
Use discounted cash flow for lifetime comparison
Simple payback stops at recovery. It also ignores when money is spent or saved. For lifetime cost, compare both options over the same years using discounted cash flows. State the discount rate and use the same basis for planned replacements, fuel-price changes and resale value.
Keep a base case and label each changed-input test. Record each price’s source, date and owner. Update the model when quotes change. Extra decimal places can’t make an uncertain input more reliable.
Before accepting a payback claim, assemble the installed quotations, annual load bands and delivered fuel tariffs. Recalculate from those documents and ask what happens if the expected operating hours do not occur.
Verify fuel security, start time and load acceptance
Compare the complete fuel supply chain
Stored diesel can support a stated period of on-site use if the fuel and supply system remain fit for use. Check usable stock, water control and the inspection plan. Check transfer pumps and their power source too.
Can fuel deliveries reach the site during the planned-for event? Normal delivery access does not answer that question.
Pipeline gas avoids routine liquid-fuel deliveries. It still needs the right pressure, flow and gas quality. Ask about peak demand and the supplier’s right to cut service.
Assess credible regional events. Don’t assume every power cut stops gas, or that a pipe means unlimited fuel.
The national-laboratory fuel-choice study record ties its findings to stated fuel-security assumptions. Apply that same care to your site. The study doesn’t prove that one fuel is always more reliable.
Illustrative scenario: One site has diesel in storage but still needs to verify that its transfer pump can work during an outage. Another has sufficient gas pressure in normal operation but lacks evidence for peak-demand conditions. Each has a different unanswered supply question; neither can claim proven autonomy from the fuel label alone.
Ask whether redundant generators share tanks, gas service, pumps or controls. N+1 redundancy does not by itself remove common fuel dependencies. Record which failure modes the architecture addresses and which remain outside it.
Turn supply questions into evidence requests
Ask the fuel supplier to answer for the event the site must cover. A normal-day promise may leave that event unaddressed. Keep these items beside the electrical design:
| Evidence request | What to check before relying on it |
|---|---|
| Diesel stock plan | Usable volume, fuel checks and a working path to the engine |
| Diesel refill plan | Supplier terms, delivery access and who requests the refill |
| Gas pressure letter | Flow, pressure and other loads included in the stated conditions |
| Gas service contract | Rights to interrupt supply and the service being purchased |
| Shared-dependency review | Pumps, controls and supplies common to redundant units |
Mark a missing answer as open. If a bidder proposes a remedy, include its cost, controls and test in the offer. Close the item with evidence, not with a new label for the same fuel supply.
Confirm the required start and transfer sequence
Define how long the loads may lose power and what restored power must meet. Review each step: fault detection, control delays, engine start and voltage build-up. Then check transfer and load acceptance. Compare the same sequence for both offers.
Cummins’ February 2019 Type 10 FAQ explains the ten-second acceptable-power concept and calls for model-specific verification. It does not support automatically excluding gas or declaring every diesel system compliant.
Confirm the adopted edition and its use on your project with the local authority and the maker. The site’s NFPA 110 fuel requirements resource is background for that conversation, rather than approval of a package. Historical OEM guidance is not a substitute for the requirements that apply to your project.
Check motors, UPS recharge and transient performance
A steady kW rating doesn’t prove that the set can accept each load step. Give suppliers the motor starting kVA, start method and load sequence. State the allowed voltage and frequency dips and recovery times. Ask for curves for the proposed package and fuel conditions.
Use the motor-starting kVA guide to assemble starting inputs. For electronic loads, the generator and UPS compatibility guide explains why UPS behaviour and recharge belong in the review. You still need evidence for each proposed model.
Fuel name alone cannot establish starting performance. Ask each supplier to address the same worst credible sequence, including an agreed restart or recharge condition. State the limits you will witness at the site test. Don’t accept unlike tests as equal proof.
For data-centre power planning, keep primary supply, emergency backup and load integration distinct. An announcement about prime gas generation does not prove another set’s emergency performance. Set the pass limits to match the actual role.
Compare emissions, permits and noise on equal terms
Keep combustion CO2 separate from whole-system emissions
The United States EIA’s September 18, 2024 coefficients give 52.91 kg CO2 per million Btu for natural gas and 74.14 for distillate fuel oil. These figures describe combustion per unit of fuel heat input. They are not emissions per electrical kWh.
To compare output, use each set’s efficiency at the loads it will carry. State the scope of any lifecycle study. Say whether it includes emissions from fuel production and supply. These combustion figures alone can’t prove a whole-system gain or a site’s savings.
Request emissions documentation for the exact engine package, fuel and operating mode. Check regulated pollutants and any required aftertreatment. Avoid assuming gas is cleaner on every measure, requires no aftertreatment, or automatically receives operating approval.
Check operating permission and site approvals
Review operating, storage, fire, electrical, gas and environmental requirements for the project location. Emergency operation and planned economic dispatch may face different conditions. Only permitted operating hours belong in the financial model.
The diesel storage regulations guide can help frame the storage review. In the United States, the EPA’s SPCC overview explains oil-spill prevention applicability. Tank capacity alone is not a complete assessment, and United States rules don’t apply worldwide.
Name who will obtain each approval and record its status. Does one quote leave out controls that the other includes? Resolve that gap before calling the lower total a saving.
Compare noise under the same conditions
Ask for noise data at the same load, distance and test conditions. Use the proposed enclosure and exhaust setup. Check where and when local noise limits apply. Don’t transfer one set’s sound figure to a new site without checking the basis.
The generator noise regulations guide supports that review. Do not assign either fuel a generic sound-level advantage from unmatched figures. Enclosure, exhaust and site design remain part of the comparison.
Consider bi-fuel and sites without pipeline access
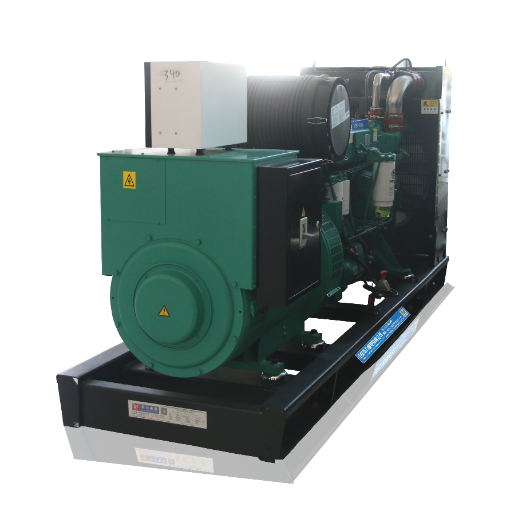
A bi-fuel design may use gas while keeping diesel injection. It needs approval for the exact engine and package. Don’t assume any diesel set can be converted. The photograph shows a generator set; it doesn’t prove a bi-fuel setup.
The bi-fuel versus dual-fuel guide explains why terminology needs clarification before comparing quotations. Ask what fuels the package uses together, how it responds to gas loss and which operating conditions its approvals cover.
Request written evidence for:
- Engine and package approval, warranty and service responsibility.
- Gas quality, pressure and control requirements.
- Substitution behaviour across the intended load range.
- Fuel-loss response and transient tests at the proposed conditions.
- Emissions documentation and operating permissions.
Don’t assume a fixed gas share, conversion price or fuel saving. Use fuel-use data for the approved package, including both fuels where needed. Price extra controls and service work in both upfront and lifetime costs.
Without a pipeline, delivered gas needs its own storage, delivery and design study. It may be possible. But this pipeline-based cost model no longer covers all the work. Diesel also needs safe storage and a workable refill plan.
For a changing site, mobile versus stationary generators addresses a separate installation choice. For sustained duty, review continuous generator operation and compare one large set with parallel units. Fuel choice does not settle maintenance coverage, transport or unit configuration.
If energy storage is also proposed, use the generator versus battery storage comparison to define its separate role. Keep its costs and operating benefits explicit rather than quietly adding them to only one fuel option.
Build a decision checklist and resolve common questions
The information to request before ordering
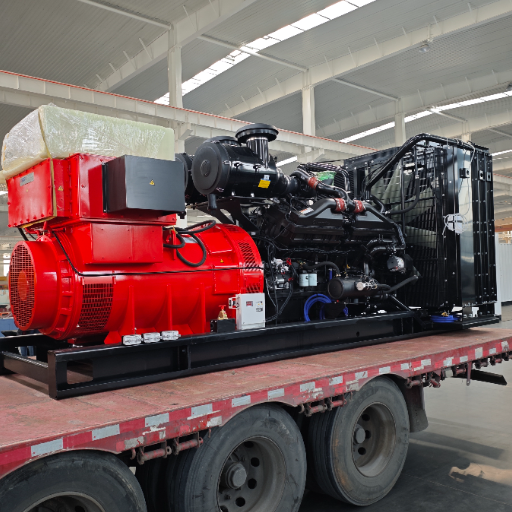
Another engineer should be able to check your choice from the same documents. Keep a short register of each input’s source, revision and owner. Mark open items. Don’t replace missing evidence with a broad assurance.
| Decision | Minimum information to assemble |
|---|---|
| Duty and output | Operating role, net kW, voltage, frequency and site conditions |
| Load response | Load bands, annual hours, start sequence and accepted dips/recovery |
| Fuel security | Usable stock or gas conditions, contracts and disruption assessment |
| Installed cost | Equal scope, exclusions, approvals and commissioning responsibilities |
| Running cost | Model fuel curves, local tariffs and service schedules |
| Economics | Common analysis period, payback assumptions and sensitivities |
| Acceptance | Required evidence, witnessed tests and documented limits |
Return to the hypothetical payback example before signing. Its assumed $140 hourly saving is not enough to choose a system if fixed charges change the recovery period or the proposed set fails the duty check. Resolve engineering feasibility first, then compare the financial results of feasible options.
Is diesel always better for standby power?
No. Stored fuel can be useful, but reliability depends on usable stock, transfer equipment, replenishment and the complete system. Gas supply also needs a site assessment. Compare the required start and load response for the exact packages rather than treating fuel as proof of compliance.
How many annual hours justify natural gas?
There is no single threshold. Find annual net savings from your load bands, fuel prices, service costs and fixed charges. Compare those savings with extra installed cost. The same total payback hours can mean different years of recovery when annual use differs.
Can a natural gas generator meet Type 10 requirements?
Do not assume either automatic eligibility or automatic exclusion. Confirm the specific package, system sequence and adopted project requirements with the manufacturer and local authority. The historical FAQ supports asking that question; it is not a project approval.
Can the same engine run both fuels?
Check the exact approved setup. Clarify the fuels, engine approval, controls, emissions and warranty. Ask what happens if gas stops. A photo or a broad conversion claim doesn’t prove your diesel set can use both fuels.
Choose the system that meets the documented duty
Make the diesel vs natural gas generator decision from checked needs, like-for-like quotes and a clear cost model. First confirm that each option meets the duty and site limits. Then compare its costs over the agreed years. Test uncertain prices and keep open design questions visible.
Discuss your project with Huali through the site’s inquiry channel. Bring the duty, load schedule, site conditions and fuel data. Ask which proposed set has evidence to meet those needs. This guide does not promise gas-product availability, performance or a financial return.
